


Charts & Stock Market Analysis


Charts & Stock Market Analysis ၏ ရွင္းလင္းခ်က္
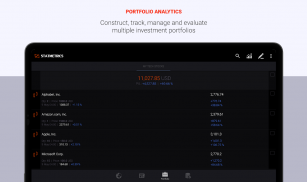
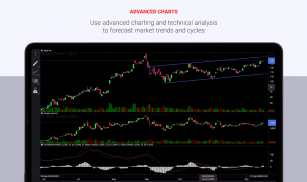
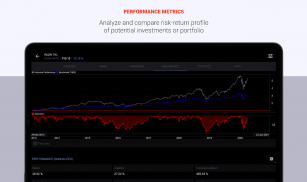
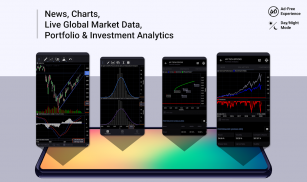
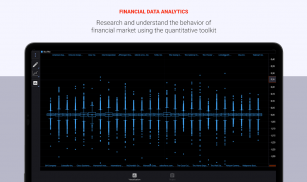
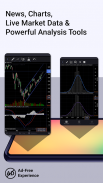
Statmetrics သည် စတော့ရှယ်ယာစျေးကွက်ခွဲခြမ်းစိတ်ဖြာမှု၊ အစုစုခွဲခြမ်းစိတ်ဖြာမှု၊ ရင်းနှီးမြှုပ်နှံမှုစီမံခန့်ခွဲမှုနှင့် သုတေသနအတွက် ပြည့်စုံသောအဖြေတစ်ခုဖြစ်သည်။ စျေးကွက်များ၏ထိပ်တွင်နေ၍ ကမ္ဘာလုံးဆိုင်ရာစျေးကွက်သတင်းများ၊ ကမ္ဘာလုံးဆိုင်ရာစတော့အိတ်ချိန်းများမှစီးပွားရေးနှင့်အချိန်နှင့်တပြေးညီဘဏ္ဍာရေးဒေတာကိုရယူပါ။ အဆင့်မြင့်ဇယားကွက်နှင့် နည်းပညာပိုင်းခြားစိတ်ဖြာမှုဖြင့် စျေးကွက်လမ်းကြောင်းများနှင့် သံသရာများကို ခန့်မှန်းပါ။ အစုရှယ်ယာများစွာကို တည်ဆောက်၊ နောက်ကြောင်းပြန်စစ်ဆေးပြီး စီမံခန့်ခွဲပြီး ပေါင်းစပ်အစုစုခွဲခြမ်းစိတ်ဖြာမှုဖြေရှင်းချက်ဖြင့် သင်၏အန္တရာယ်စီမံခန့်ခွဲမှုကို ချောမွေ့စေပါသည်။ အစုစု သို့မဟုတ် အလားအလာရှိသော ရင်းနှီးမြှုပ်နှံမှုများ၏ အခြေခံနှင့် အရေအတွက် လက္ခဏာရပ်များကို ပိုင်းခြားစိတ်ဖြာပြီး သင့်ရင်းနှီးမြှုပ်နှံမှုများ၏ စွန့်စားရမှု ပရိုဖိုင်ကို ထိုးထွင်းသိမြင်ပါ။ အကောင့်အားလုံးရှိ သင့်အစုစု၏ အလုံးစုံစွမ်းဆောင်ရည်ကို တစ်နေရာတည်းတွင် ခြေရာခံပြီး သင်၏ ရင်းနှီးမြှုပ်နှံမှုနည်းဗျူဟာကို အကဲဖြတ်ပါ။ သင်၏ ရင်းနှီးမြှုပ်နှံမှု သုတေသနကို မြှင့်တင်ပါ၊ ရင်းနှီးမြှုပ်နှံမှု အခွင့်အလမ်းများကို စူးစမ်းလေ့လာပြီး သင်၏ ရင်းနှီးမြှုပ်နှံမှုများအပေါ် သက်ရောက်မှုရှိသော လျှို့ဝှက်ထားသော စွန့်စားရမှုများကို ခွဲခြားပိုင်းခြားနိုင်သော ကိရိယာများနှင့် ငွေကြေးပုံစံများ အစုံအလင်ဖြင့် ခွဲခြားသတ်မှတ်ပါ။
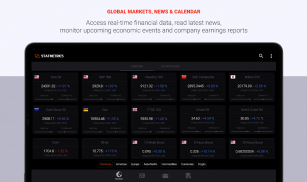
ကမ္ဘာ့စျေးကွက်များနှင့် ဘဏ္ဍာရေးသတင်းများ
- အဓိကဘဏ္ဍာရေးတူရိယာများ (အညွှန်းကိန်းများ၊ စတော့များ၊ ငွေချေးစာချုပ်များ၊ အပြန်အလှန်ရန်ပုံငွေများ၊ ETFs၊ ကုန်စည်များ၊ ငွေကြေးများ၊ crypto၊ အတိုးနှုန်းများ၊ အနာဂတ်များနှင့် ရွေးချယ်စရာများ) အတွက် တိုက်ရိုက်ကိုးကားချက်များနှင့် ဇယားများကို ကမ္ဘာလုံးဆိုင်ရာဖလှယ်မှုများတွင် အရောင်းအဝယ်ပြုလုပ်ပါ။
- အသုံးပြုသူသတ်မှတ်ထားသောရှာဖွေမှုဘောင်များအလိုက် ရှယ်ယာများ၊ ရန်ပုံငွေများနှင့် ETFs များကို ရှာဖွေရန်အတွက် စျေးကွက်ရှာဖွေရေးစနစ်။
- ကုန်သွယ်မှုစိတ်ကူးများကို သိမ်းဆည်းရန်အတွက် စိတ်ကြိုက်ကြည့်ရှုစာရင်းများနှင့် မှတ်စုစာအုပ်များ။
- စီးပွားရေးဖြစ်ရပ်များနှင့်ကုမ္ပဏီဝင်ငွေအစီရင်ခံစာများအတွက်ပြက္ခဒိန်။
- ဒေသအများအပြားနှင့်ဘာသာစကားများအတွက်ဘဏ္ဍာရေးသတင်းလွှမ်းခြုံ
- အသုံးပြုသူမှပေါင်းစပ် RSS-Reader နှင့် သတင်း feed စာရင်းသွင်းမှု။
- တိကျသောသော့ချက်စာလုံးများဖြင့် သတင်းခေါင်းကြီးပိုင်းများနှင့် Google Trends စာရင်းဇယားများကို ရှာဖွေပါ။
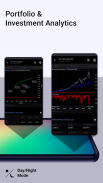
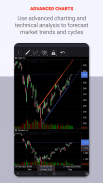
ဇယားဆွဲခြင်းနှင့် နည်းပညာဆိုင်ရာ ခွဲခြမ်းစိတ်ဖြာခြင်း။
- အပြန်အလှန်အကျိုးသက်ရောက်မှုမြင့်မားသောဇယားကွက်များနှင့်ပုံဆွဲကိရိယာများ၏ကျယ်ပြန့်အကွာအဝေး။
- အသုံးများသော နည်းပညာဆိုင်ရာ အညွှန်းကိန်း အများအပြား။
- အတွင်းနေ့နှင့်သမိုင်းဇယားများအတွက်စိတ်ကြိုက်ပုံစံများ။
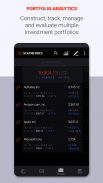
အစုစုခွဲခြမ်းစိတ်ဖြာမှုနှင့် ရင်းနှီးမြှုပ်နှံမှု သုတေသန
- ကုန်သွယ်မှုသမိုင်းကို အခြေခံ၍ ရင်းနှီးမြှုပ်နှံမှုဗျူဟာများကို အစုစုစွမ်းဆောင်ရည်ခြေရာခံခြင်းနှင့် ခွဲခြမ်းစိတ်ဖြာခြင်း။
- ငွေကြေးမျိုးစုံနှင့် တိုတောင်းသော အစုရှယ်ယာများကို ဆောက်လုပ်ရေး၊ backtesting နှင့် စီမံခန့်ခွဲခြင်း။
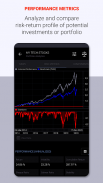
- အစုစုနှင့် ၎င်း၏ အစိတ်အပိုင်းများ၏ အခြေခံနှင့် အရေအတွက် စွမ်းဆောင်ရည်နှင့် စွန့်စားသုံးသပ်မှု။
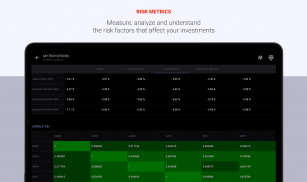
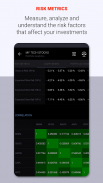
- စွမ်းဆောင်ရည်နှင့် စံနှုန်းများကို တိုင်းတာခြင်း နှင့် ရင်းနှီးမြှုပ်နှံမှု အန္တရာယ် အညွှန်းကိန်းများ တွက်ချက်ခြင်း (ပြန်လာခြင်း၊ မတည်ငြိမ်ခြင်း၊ Sharpe အချိုး၊ အများဆုံး နုတ်ထွက်ခြင်း၊ တန်ဖိုး-အန္တရာယ်၊ မျှော်မှန်းထားသော မလုံလောက်မှု၊ အယ်လ်ဖာ၊ ဘီတာ၊ အချက်အလက်များ အချိုးအစား စသည်)။
- စိတ်ဖိစီးမှုဖြစ်ရပ်များကို ခွဲခြမ်းစိတ်ဖြာခြင်း၊ နှိမ့်ချမှုများနှင့် သမိုင်းဆိုင်ရာနှင့် မွမ်းမံထားသော တန်ဖိုးများကို တိုင်းတာခြင်း။
- ပိုင်ဆိုင်မှုခွဲဝေမှု၊ ကဏ္ဍခွဲဝေမှု၊ ဆက်စပ်မှုနှင့် အစုစု၏ စွန့်စားပြိုကွဲမှုကို အကဲဖြတ်ခြင်း။
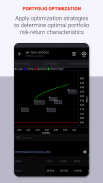
- လုံခြုံရေးစျေးကွက်မျဉ်း၊ လုံခြုံရေးလက္ခဏာမျဉ်း၊ ထိရောက်သောနယ်နိမိတ်နှင့် ရင်းနှီးမြုပ်နှံမှုအန္တရာယ်ညွှန်းကိန်းများကို ပုံဖော်ခြင်း။
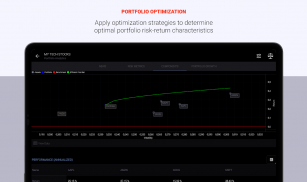
- ကြိုတင်သတ်မှတ်ထားသော အဓိပ္ပါယ်ကွဲလွဲမှု အစုစုကို ပိုမိုကောင်းမွန်အောင်ပြုလုပ်ခြင်း ဗျူဟာများ (အနည်းဆုံးကွဲလွဲမှု၊ အများဆုံးကွဲပြားမှု၊ အများဆုံးဆက်စပ်မှု၊ ညီမျှသော စွန့်စားပါဝင်မှု စသည်)။
- ဝင်ငွေစာရင်းရှင်းတမ်း၊ လက်ကျန်ရှင်းတမ်း၊ ငွေသားစီးဆင်းမှုရှင်းတမ်း၊ အဖွဲ့အစည်းဆိုင်ရာကိုင်ဆောင်ထားသူများ၊ အပြန်အလှန်ရန်ပုံငွေကိုင်ဆောင်ထားသူများ၊ ကုမ္ပဏီပရိုဖိုင်များနှင့် အဓိကဘဏ္ဍာရေးအချိုးများကို မြင်သာစေရန်အတွက် အခြေခံခွဲခြမ်းစိတ်ဖြာခြင်း။
- အစုရှယ်ယာတစ်ခုချင်းဒေတာ၊ တန်ဖိုးဖြတ်မှုအချိုး၊ အမြတ်အစွန်း၊ တိုးတက်မှု၊ သုံးစွဲနိုင်မှု၊ ငွေဖြစ်လွယ်မှု၊ အမြတ်ဝေစုတိုးတက်မှုနှင့် အမြတ်ဝေစုမှတ်တမ်းများကဲ့သို့သော အခြေခံအချက်များကို အကဲဖြတ်ခြင်း။
- တစ်ခုတည်းပိုင်ဆိုင်မှု၊ အစုစု သို့မဟုတ် စောင့်ကြည့်စာရင်းတစ်ခုအတွက် အုပ်စုဖော်ပြချက်စာရင်းဇယားကို တွက်ချက်ခြင်း။
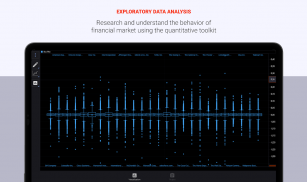
- ကိန်းဂဏန်းဆိုင်ရာ အမြင်အာရုံနှင့် အယူအဆစမ်းသပ်ခြင်း (ယူနစ်အမြစ်စမ်းသပ်မှု၊ Granger အကြောင်းရင်းစမ်းသပ်မှု စသည်ဖြင့်)။
- ဆက်စပ်မှု၊ ပေါင်းစည်းမှု၊ ဆုတ်ယုတ်မှုနှင့် အဓိကအစိတ်အပိုင်းခွဲခြမ်းစိတ်ဖြာမှု။
ငွေကြေးနှင့် စီးပွားရေးဒေတာ (တိုက်ရိုက်ဝင်ရောက်ခွင့်)
- IEX စတော့အိတ်ချိန်း (အမေရိကန်စတော့များ)
- Alpha Vantage (စတော့ရှယ်ယာများ၊ Forex နှင့် cryptocurrencies)
- Barchart.com (စတော့ရှယ်ယာများ၊ အနာဂတ်များနှင့် Forex)
- Cryptocompare.com (crypto ငွေကြေးများ)
- Stooq.com (စတော့ရှယ်ယာများ၊ အညွှန်းကိန်းများ၊ ငွေကြေးများ၊ ငွေချေးစာချုပ်များ၊ ကုန်ပစ္စည်းများ)
- Tiingo.com (ETFs၊ Mutual Funds နှင့် Chinese A-Shares)
- Quandl.com (စီးပွားရေးဒေတာ): ဂျပန်ဗဟိုဘဏ်၊ အင်္ဂလန်ဘဏ်၊ Deutsche Bundesbank၊ European Central Bank Data (ECB)၊ Federal Reserve Economic Data (FRED)၊ World Bank၊ International Monetary Fund (IMF) နှင့် OECD။
Charts & Stock Market Analysis - ဗားရွင္း 2.38
(19-08-2024)

Charts & Stock Market Analysis - APK သတင္းအခ်က္အလက္
APK ဗားရွင္း: 2.38package: org.statmetrics.appCharts & Stock Market Analysis ၏ ေနာက္ဆုံးဗားရွင္း


က႑တူအက္ပ္မ်ား

သင္ႏွစ္သက္ႏိုင္သည္မ်ားမွာ...


